LLM Monitoring and Observability: Tools, Tips and Best Practices
Discover expert strategies, essential tools, and the latest best practices for effective LLM Monitoring and Observability in our comprehensive 2024 guide.
By: Hudson Buzby, Solutions Architect at Qwak
For most of the engineering world, our introduction to Large Language Models was through the lens of a simple chat interface on the OpenAI UI. Amazed as it quickly explained complex problems, etched sonnets, and provided the solution to that nagging bug in our code we had been stuck on for weeks, the practicality and versatility of LLM’s to both technical and non-technical problems was immediately apparent. In a short period of time, this was going to be employed everywhere and we needed to start taking it out of the chat interface and into our application code.
Fast forward 18 months, organizations of all sectors, industries, and sizes have identified use cases, experimented with the capabilities and solutions, and have begun to integrate these LLM workflows into their engineering environment. Whether a chatbot, product recommendations, business intelligence or content crafting, LLMs have moved past proof of concept into productionalization. However, the nature in which these LLM applications are deployed often resembles something of a weekend project rather than a traditional production grade service. While large language models may provide ease in terms of their versatility and solution delivery, the flexibility and boundless nature of their responses presents unique challenges that require specific approaches to the maintenance of the service over time.
Now that you have an LLM service running in production, it’s time to talk about maintenance and upkeep. In this blog post, we’ll discuss some of the requirements, strategies, and benefits of LLM monitoring and observability. Implementing proper LLM monitoring and observability will not only keep your service running and healthy, but also allow you to improve and strengthen the responses that your LLM workflow provides.
What is LLM Monitoring and Observability
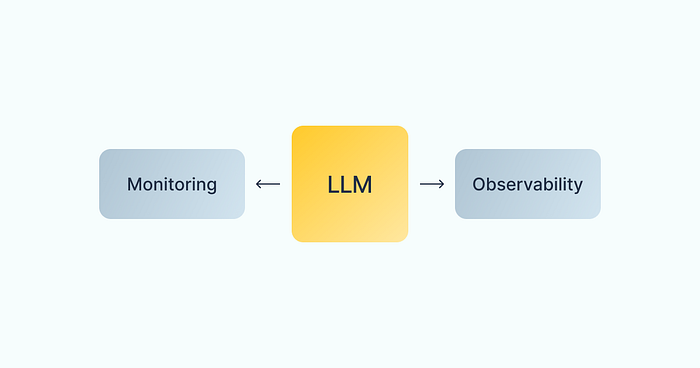
LLM monitoring involves the systematic collection, analysis, and interpretation of data related to the performance, behavior, and usage patterns of Large Language Models. This encompasses a wide range of evaluation metrics and indicators such as model accuracy, perplexity, drift, sentiment, etc. Monitoring also entails collecting resource or service specific performance indicators such as throughput, latency, and resource utilization. Like any production service, monitoring Large Language Models is essential for identifying performance bottlenecks, detecting anomalies, and optimizing resource allocation. By continuously monitoring key metrics, developers and operators can ensure that LLMs stay running at full capacity and continue to provide the results expected by the user or service consuming the responses.
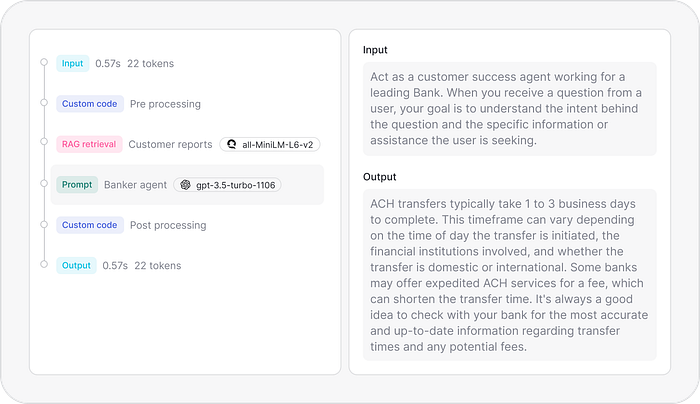
On the other hand, LLM observability refers to the ability to understand and debug complex systems by gaining insights into their internal state through tracing tools and practices. For Large Language Models, observability entails not only monitoring the model itself but also understanding the broader ecosystem in which it operates, such as the feature pipelines or vector stores that feed the LLM valuable information. Observability allows developers to diagnose issues, trace the flow of data and control, and gain actionable insights into system behavior. As the complexity of LLM workflows increases and more data sources or models are added to the pipeline, tracing capabilities will become increasingly valuable to locating the change or error in the system that is causing unwanted or unexpected results.
Requirements for LLM Monitoring and Observability
From an evaluation perspective, before we can dive into the metrics and monitoring strategies that will improve the yield of our LLM, we need to first collect the data necessary to undergo this type of analysis. At its core, the LLM inputs and outputs are quite simple — we have a prompt and we have a response. In order to do any kind of meaningful analysis, we need to find a way to persist the prompt, the response, and any additional metadata or information that might be relevant into a data store that can easily be searched, indexed, and analyzed. This additional metadata could look like vector resources referenced, guardrail labeling, sentiment analysis, or additional model parameters generated outside of the LLM. Whether this is a simple logging mechanism, dumping the data into an S3 bucket or a data warehouse like Snowflake, or using a managed log provider like Splunk or Logz, we need to persist this valuable information into a usable data source before we can begin conducting analysis.
From a resource utilization and tracing perspective, LLM’s are truly like any other machine learning model or application service that you might monitor. Like any other application, LLM’s consume memory, and utilize CPU and GPU resources. There are countless open source and managed tools that will help you keep track of the necessary resource metrics to monitor your applications such as Prometheus for metric collection, Grafana for visualization and tracing, or DataDog as a managed platform for both collection and APM.
Metrics and Strategies for LLM Monitoring
Now that we have the foundation for proper analysis, we can discuss metrics and strategies to improve the reliability and accuracy of your LLM applications.
Evaluation Metrics
Because of the free form nature of large language models, we have to employ metric strategies that focus on evaluating the quality and relevance of the content generated. However, there are some traditional ML evaluation metrics that can be employed to look at input data that may be sent to LLMs. Let’s discuss a few:
Perplexity
Perplexity quantifies how well a language model predicts a sample of text or a sequence of words. Lower perplexity values indicate better performance, as it suggests that the model is more confident and accurate in its predictions. Mathematically, perplexity is calculated using the following formula:

In simpler terms, perplexity measures how surprised a language model is when predicting the next word in a sequence. A lower perplexity indicates that the model is less surprised, meaning it is more confident and accurate in its predictions. Conversely, a higher perplexity suggests that the model is more uncertain and less accurate. HuggingFace provides a great utility tool for helping you measure perplexity in your applications.
Cosine Similarity
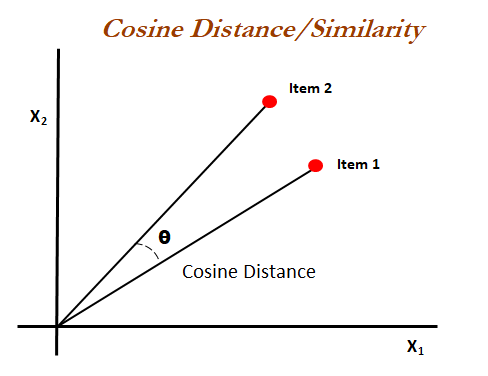
Cosine similarity is a valuable metric for evaluating the similarity between two vectors in a high-dimensional space, often used in NLP tasks such as comparing text documents and to index and search values in a vector store. In the case of evaluating Large Language Model, cosine similarity can be used to evaluate LLM responses against test cases. By computing the cosine similarity between the vector representations of the LLM-generated response and the test case, we can quantify the degree of similarity between them. A higher cosine similarity indicates greater resemblance between the generated response and the test case, or put simply, higher accuracy. This approach enables numerical evaluation in an otherwise subject comparison, providing insights into the model’s performance and helping identify areas for prompt improvement.
Sentiment Analysis
For a more categorical or high-level analysis, sentiment analysis serves as a valuable metric for assessing the performance of LLMs by gauging the emotional tone and contextual polarity of their generated response. Sentiment analysis can be employed to analyze the sentiment conveyed in the model’s responses and compare it against the expected sentiment in the test cases. This evaluation provides valuable insights into the model’s ability to capture and reproduce the appropriate emotional context in its outputs, contributing to a more holistic understanding of its performance and applicability in real-world scenarios. Sentiment analysis can be conducted using traditional machine learning methods such as VADER, Scikit-learn, or TextBlob, or you can employ another large language model to derive the sentiment. It might seem counterintuitive or dangerous, but using LLM’s to evaluate and validate other LLM responses can yield positive results. Ultimately, integrating sentiment analysis as a metric for evaluation enables researchers to identify deeper meanings from the responses, such as potential biases, inconsistencies, or shortcomings, paving the way for prompt refinement and response enhancement.

Model Drift
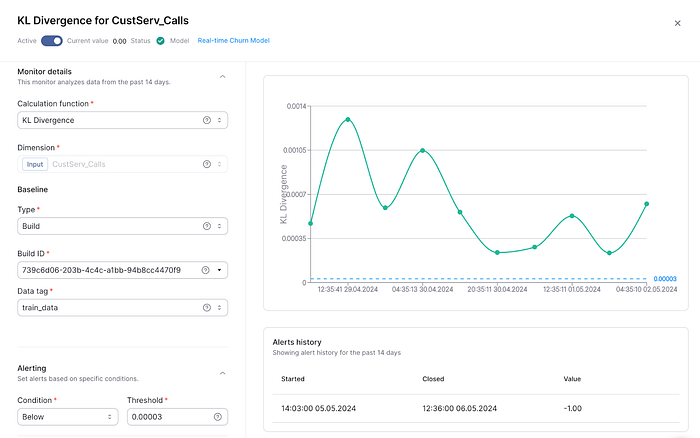
Now model drift may not be the first metric that comes to mind when thinking of LLM’s, as it is generally associated with traditional machine learning, but it can be beneficial to tracking the underlying data sources that are involved with fine-tuning or augmenting LLM workflows. Model drift refers to the phenomenon where the performance of a machine learning model deteriorates over time due to changes in the underlying data distribution. In RAG (Retrieval Augmented Generation) workflows, external data sources are incorporated into the prompt that is sent to the LLM to provide additional contextual information that will enhance the response. If the underlying data sources significantly change over time, the quality or relevance of your prompts will also change and it’s important to measure this as it relates to the other evaluation metrics defined above.
Model drift can be calculated by continuously comparing the model’s predictions against the ground truth labels or expected outcomes generated by the underlying data sources. By incorporating metrics such as accuracy, precision, recall, and F1 score over time, deviations from the expected performance can be detected. Techniques such as distributional drift analysis, where the distribution of input data is compared between different time periods, can help identify shifts in the underlying data sources that may affect the model’s performance. Regularly assessing model drift allows proactive adjustments to be made, such as adjusting the input prompt, changing the RAG data sources, or executing a new fine-tuning of the model with updated data that will ensure the LLM maintains its effectiveness and relevance in an evolving environment.
Resource Utilization
Monitoring resource utilization in Large Language Models presents unique challenges and considerations compared to traditional applications. Unlike many conventional application services with predictable resource usage patterns, fixed payload sizes, and strict, well defined request schemas, LLMs are dynamic, allowing for free form inputs that exhibit dynamic range in terms of input data diversity, model complexity, and inference workload variability. In addition, the time required to generate responses can vary drastically depending on the size or complexity of the input prompt, making latency difficult to interpret and classify. Let’s discuss a few indicators that you should consider monitoring, and how they can be interpreted to improve your LLMs.

CPU
Monitoring CPU usage is crucial for understanding the concurrency, scalability, and efficiency of your model. LLMs rely on CPU heavily for pre-processing, tokenization of both input and output requests, managing inference requests, coordinating parallel computations, and handling post-processing operations. While the bulk of the computational heavy lifting may reside on GPU’s, CPU performance is still a vital indicator of the health of the service. High CPU utilization may reflect that the model is processing a large number of requests concurrently or performing complex computations, indicating a need to consider adding additional server workers, changing the load balancing or thread management strategy, or horizontally scaling the LLM service with additional nodes to handle the increase in requests.
GPU
Large Language Models heavily depend on GPUs for accelerating the computation-intensive tasks involved in training and inference. In the training phase, LLMs utilize GPUs to accelerate the optimization process of updating model parameters (weights and biases) based on the input data and corresponding target labels. During inference, GPUs accelerate the forward-pass computation through the neural network architecture. By leveraging parallel processing capabilities, GPUs enable LLMs to handle multiple input sequences simultaneously, resulting in faster inference speeds and lower latency. And as anyone who has followed Nvidia’s stock in recent months can tell you, GPU’s are also very expensive and in high demand, so we need to be particularly mindful of their usage. Contrary to CPU or memory, relatively high GPU utilization (~70–80%) is actually ideal because it indicates that the model is efficiently utilizing resources and not sitting idle. Low GPU utilization can indicate a need to scale down to smaller node, but this isn’t always possible as most LLM’s have a minimum GPU requirement in order to run properly. Therefore, you’ll want to be observing GPU performance as it relates to all of the resource utilization factors — CPU, throughput, latency, and memory — to determine the best scaling and resource allocation strategy.
Memory
Memory serves two significant purposes in LLM processing — storing the model and managing the intermediate tokens utilized for generating the response. The size of an LLM, measured by the number of parameters or weights in the model, is often quite large and directly impacts the available memory on the machine. Similar to GPU’s, the bare minimum memory requirements for storing the model weights prevent us from deploying on small, cheap infrastructure. During inference, LLMs generate predictions or responses based on input data, requiring memory to store model parameters, input sequences, and intermediate activations. Memory constraints may limit the size of input sequences that can be processed simultaneously or the number of concurrent inference requests that can be handled, impacting inference throughput and latency. In cases of high memory usage or degraded latency, optimizing memory usage during inference by employing techniques such as batch processing, caching, and model pruning can improve performance and scalability. Ultimately, managing memory on large language models is a balancing act that requires close attention to the consistency and frequency of the incoming requests.
Throughput and Latency
For all the reasons listed above, monitoring LLM throughput and latency is challenging. Unlike traditional application services, we don’t have a predefined JSON or Protobuf schema ensuring the consistency of the requests. One request may be a simple question, the next may include 200 pages of PDF material retrieved from your vector store. Looking at average throughput and latency on the aggregate may provide some helpful information, but it’s far more valuable and insightful when we include context around the prompt — RAG data sources included, tokens, guardrail labels, or intended use case categories.
This is why proper prompt response logging is so vital. Service performance indicators need to be analyzed in the context of their intended use case. LLM monitoring requires a deep understanding of our use cases and the individual impact each of these use cases have on CPU, GPU, memory and latency. Then, we can understand the necessary resource requirements and use this knowledge to select our resource, load balancing, and scaling configurations. If we were building a REST API for a social media site, we wouldn’t have every single state change running through a single API endpoint right? The same logic applies to LLMs. We need to choose the infrastructure, resources and models that fit best with our needs.
Tracing
Tracing events through an LLM system or RAG application can be an effective way to debug, diagnose issues, and evaluate changes over time. While RAG workflows had simple beginnings, they are quickly evolving to incorporate additional data sources like features stores or relational databases, pre or post-processing steps, or even supplementary machine learning models for filtering, validation or sentiment detection. Tracing allows developers to monitor the flow of data and control through each stage of the pipeline. When a RAG pipeline is producing unintended results, with so many layers of complexity, it can be challenging to determine if the bug is the result of a poor vector storage, an issue with prompt construction, an error in some external API call, or with the LLM itself. Tracing enables you to follow the flow of data from request to request to locate the unexpected change in this complex pipeline and remedy the issue faster.
Best Practices and When to Implement
There’s no one size fits all approach to LLM monitoring. Strategies like drift analysis or tracing might only be relevant for more complex LLM workflows that contain many models or RAG data sources. The use case or LLM response may be simple enough that contextual analysis and sentiment monitoring may be overkill. It really requires understanding the nature of the prompts that are being sent to your LLM, the range of responses that your LLM could generate, and the intended use of these responses by the user or service consuming them. However, at a minimum, almost any LLM monitoring would be improved with proper persistence of prompt and response, as well as typical service resource utilization monitoring, as this will help to dictate the resources dedicated for your service and to maintain the model performance you intend to provide.
How Qwak can help
Qwak is an end-to-end MLOPS and Generative AI platform that manages the infrastructure required for advanced machine learning development as well as the observability and monitoring capabilities necessary for maintaining your models. Qwak provides solutions for training, experiment tracking, model registry, inference deployment — real-time, streaming, and batch — as well as monitoring, alerting, and automation. When you deploy models on Qwak, your requests and predictions are automatically synced to our analytics lake, where you can directly query your results in SQL. Metrics like drift, cosine similarity, L2, or perplexity can be easily calculated directly in the platform, or you can export back into your data lake for further analysis. Observability and performance dashboards come out of box, so you can immediately begin tracking model throughput, latency, and resource utilization. Also, in the coming months, we’ll be releasing our new LLM platform that will include prompt templating and versioning, LLM tracing, advanced A/B testing strategies, and specific LLM monitoring.

Originally published at https://www.qwak.com.
